
Glossary
Process Flow Diagram
 ChatGPT
 Perplexity
 Gemini
 Claude
What is a process flow diagram?
A process flow diagram is a visual map of the steps, decisions, handoffs, and outcomes in a process. It uses shapes, arrows, labels, and sometimes swimlanes to show how work moves from a starting point to an end result. 1
The diagram earns its keep when prose gets too flat. A written procedure can tell someone what to do, but a diagram shows where work branches, loops back, waits for approval, or changes owners.
What a process flow diagram shows
A useful process flow diagram answers one question before everything else: what happens next?
For a simple process, that might be a straight line of actions. For a real team workflow, it usually includes decision points, role handoffs, exception paths, and loops where incomplete work comes back for revision. 2
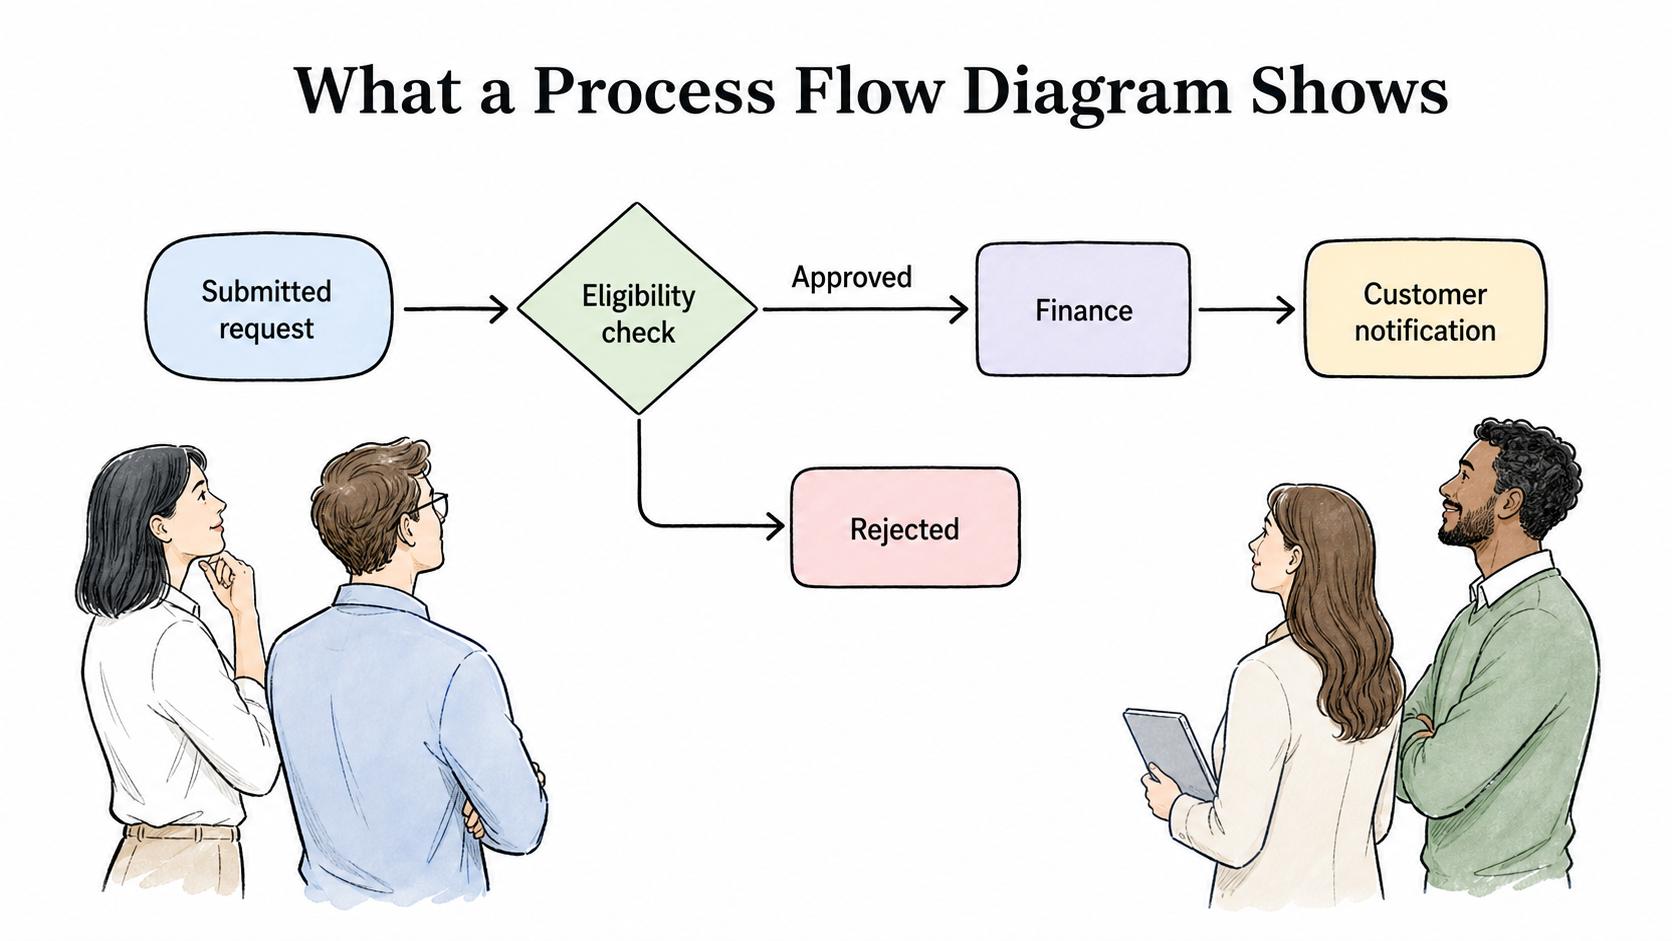
A refund process, for example, might start with a submitted request, move to an eligibility check, split into approved and rejected paths, send approved refunds to finance, and end with a customer notification. The SOP explains the details. The diagram shows the route.
Process flow diagram vs. process flow
A process flow is the actual sequence of work. A process flow diagram is the artifact that represents it.
That distinction keeps teams honest. Updating the diagram doesn't improve the process unless the workflow, decision rules, tools, or ownership change too. The diagram is useful because it makes the current or intended flow easier to inspect.
Use the diagram when people need orientation. Use a guide, SOP, checklist, or work instruction when they need exact execution details.
Common process flow diagram elements
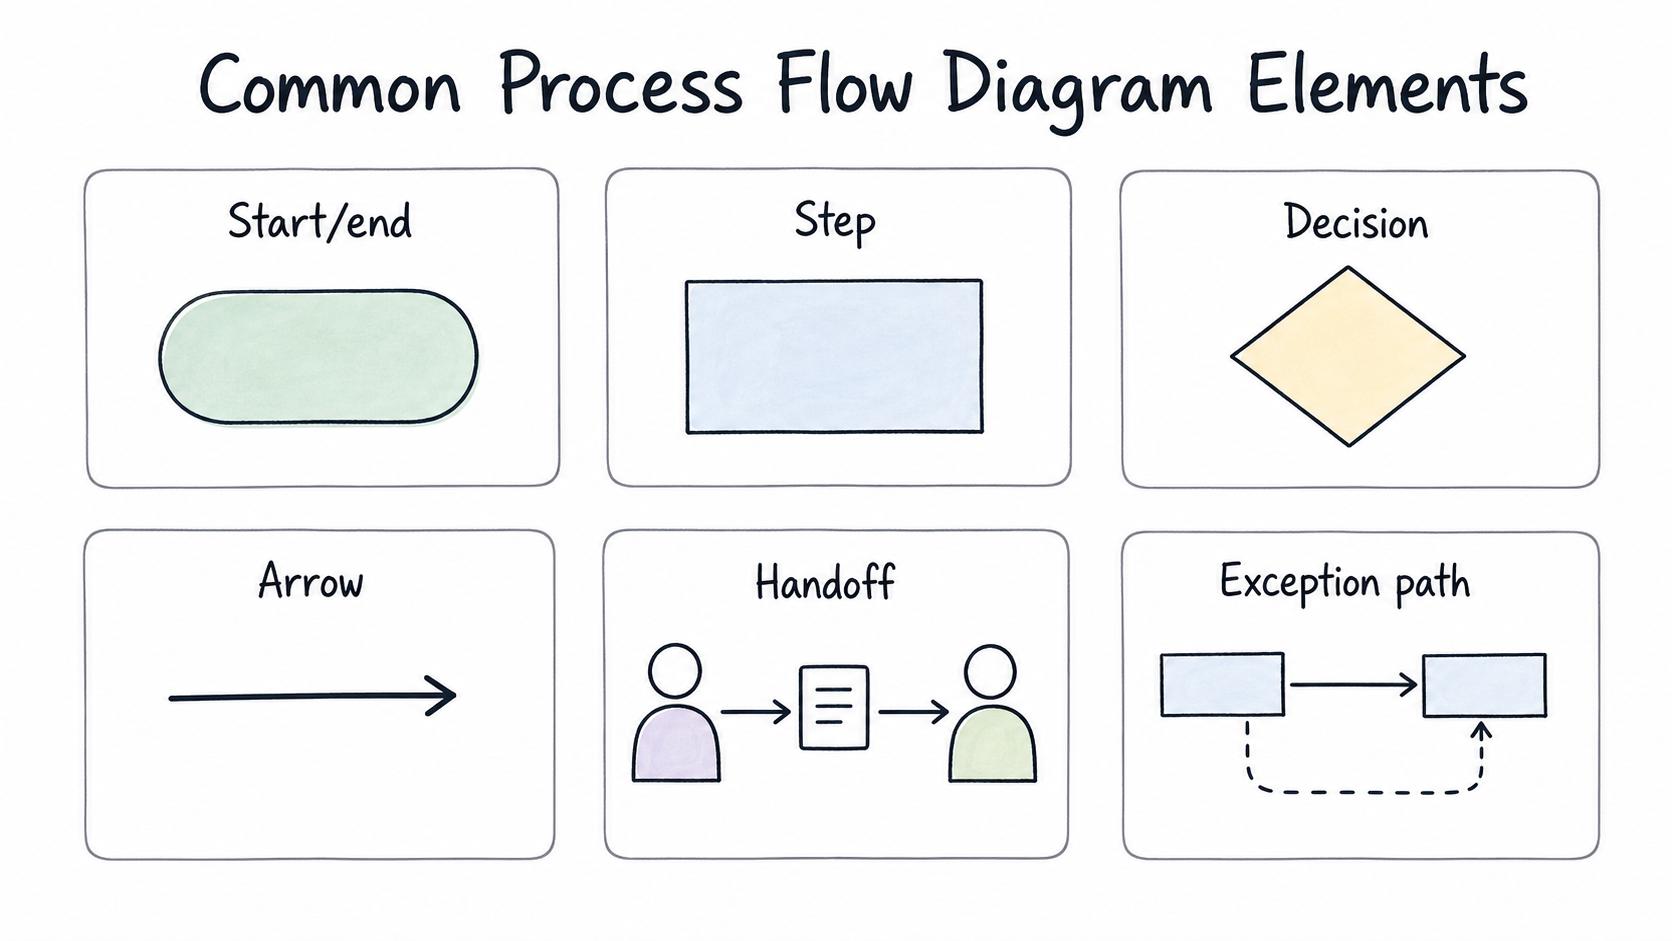
Most teams only need a small symbol set. More shapes can make a diagram look formal while making it harder to read. 3
| Element | What it shows | What to watch for |
|---|---|---|
| Start/end | The process boundary | A vague starting point makes scope creep easier |
| Step | A task or action | Steps should be written as actions, not broad phases |
| Decision | A yes/no or routed choice | The decision rule may need supporting notes outside the diagram |
| Arrow | Direction of work | Crossing arrows usually mean the layout needs cleanup |
| Handoff | Work moving to another role or team | Handoffs are where delays and missing context often appear |
| Exception path | What happens when the normal path does not apply | Too many exceptions may deserve a separate diagram |
The strongest diagrams are selective. They show enough structure to reason about the process without trying to hold every instruction on the canvas.
When to use a process flow diagram
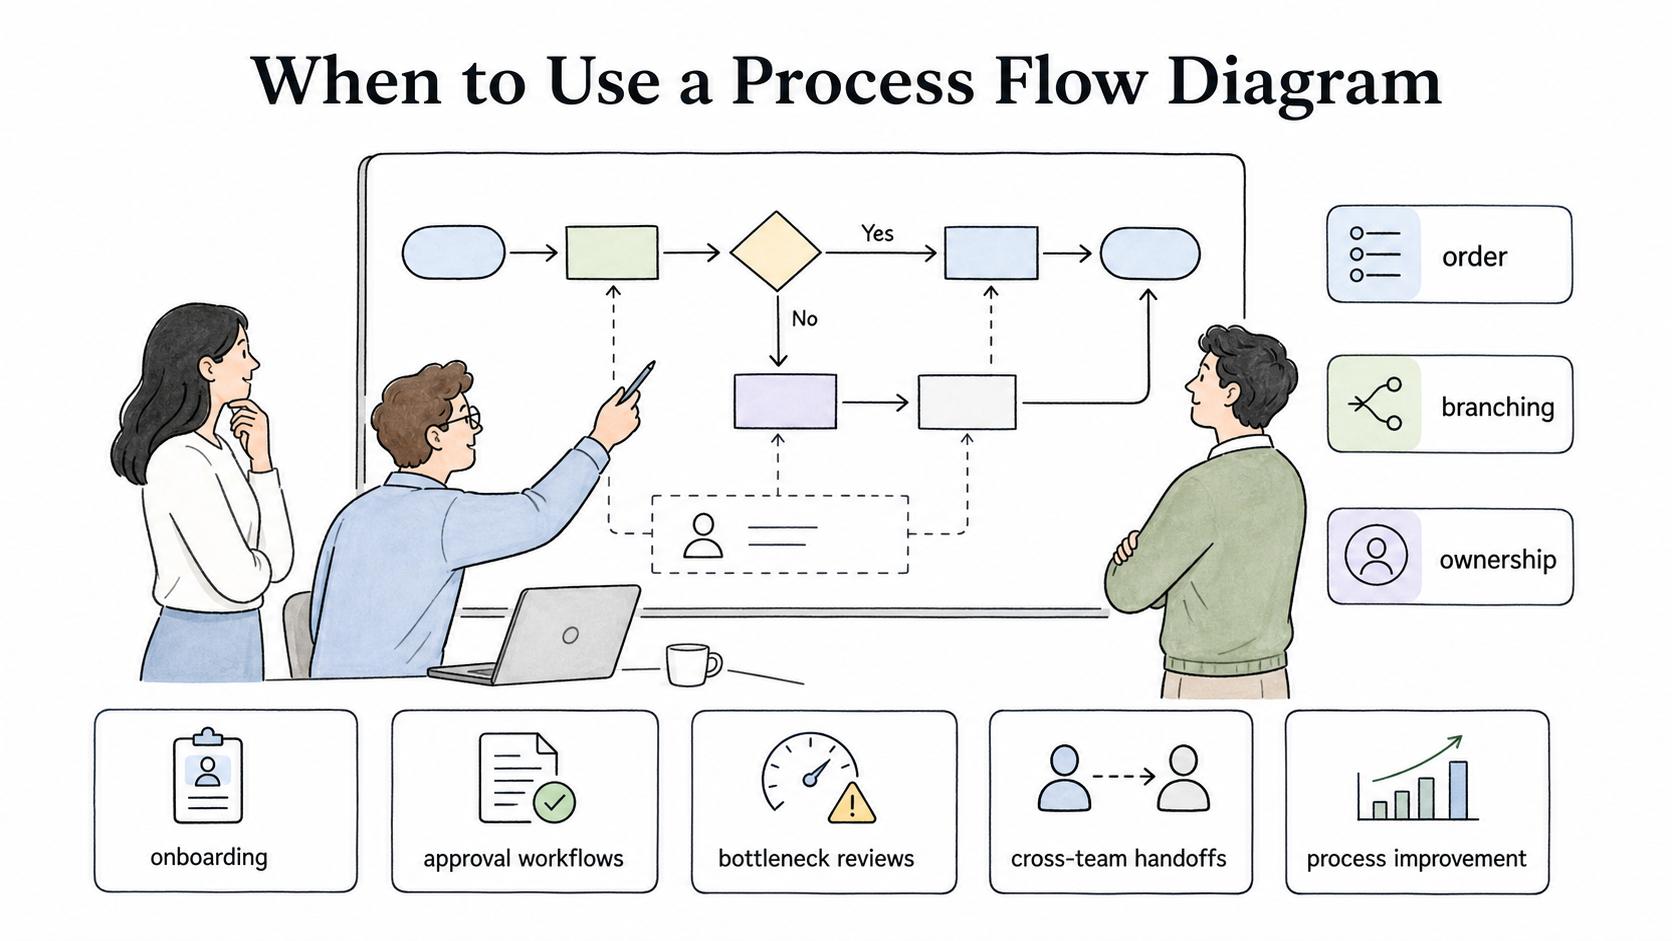
Use a process flow diagram when order, branching, or ownership is the part people keep misunderstanding.
It works well for onboarding, approval workflows, current-state and future-state comparisons, bottleneck reviews, process improvement discussions, and cross-team handoffs. In each case, the diagram gives people a shared view of where work goes before they argue about how to fix it.
A diagram is weaker when the process is already obvious, when the hard part is judgment, or when people need detailed steps more than visual orientation. In those cases, a checklist, decision guide, or SOP may do the job better.
How to create a process flow diagram
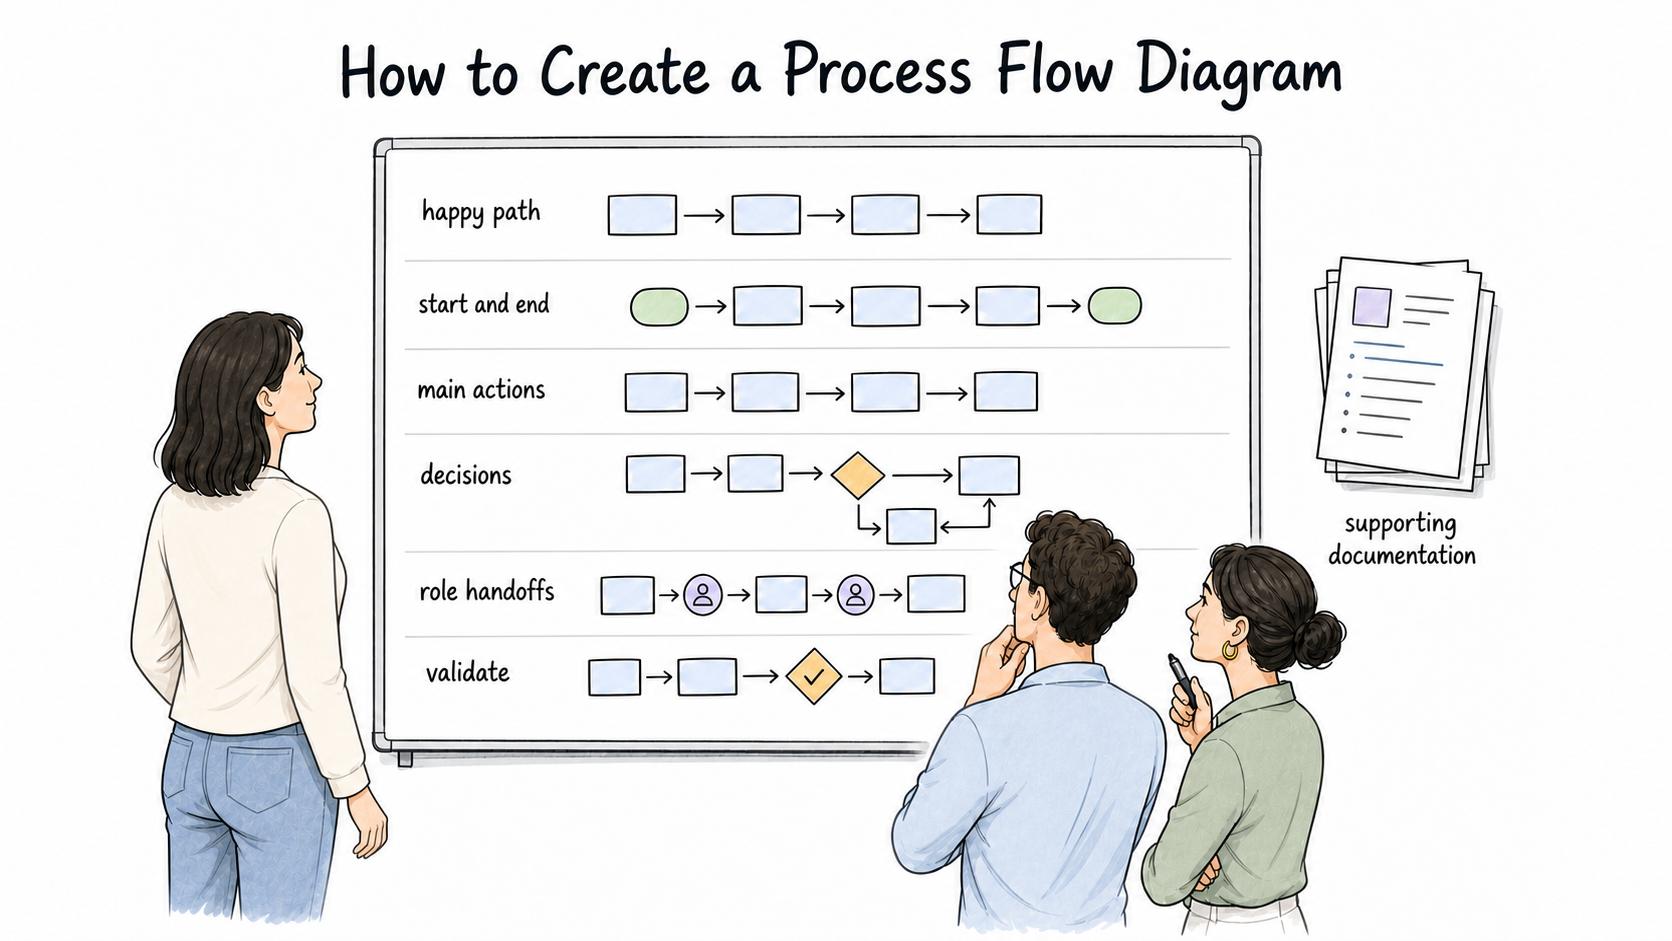
Start with the happy path. If the first draft tries to include every edge case, it will look complete before it's understandable.
Define the start and end points, list the main actions in order, add the decisions that change the route, mark role handoffs, and then validate the diagram with someone who performs the process. That validation is usually where the diagram gets useful: people surface skipped systems, undocumented approvals, and informal workarounds that don't appear in the official version.
Once the structure is right, decide what belongs outside the diagram. Decision criteria, screenshots, field-level instructions, and escalation notes usually belong in supporting documentation, not squeezed into tiny labels.
Common mistakes
One mistake is treating the diagram as a process owner. It can show who does what, but someone still has to keep it accurate as the workflow changes.
Another mistake is drawing the ideal process when the team needs the real current process. Future-state diagrams are useful, but they need a clear label. If people think a future-state diagram describes reality, the improvement conversation starts from the wrong map.
The most costly mistake is hiding the messy parts. Rework loops, missing-input paths, and exception handling are often the most valuable parts of the diagram because they reveal where the process actually loses time. 4
Documentation takeaway
A process flow diagram works best beside execution documentation. The diagram gives the visual route through the work. The SOP, guide, checklist, or work instruction explains how to complete each step.
For training, use the diagram to orient people before they practice the process. For improvement, use it to find where work slows down, changes hands, or comes back for rework.
How Trails helps
Trails helps teams capture a workflow as someone performs it and turn that workflow into a polished step-by-step guide. That guide can sit next to a process flow diagram so employees have both the visual overview and the exact instructions.
When a process changes, Trails can also help create updated documentation and an AI-narrated video version for training, making the diagram easier to translate into daily behavior.
Sources
- 1
Agency for Healthcare Research and Quality. Flowchart. digital.ahrq.gov/health-it-tools-and-resources/evaluation-resources/workflow-assessment-health-it-toolkit/all-workflow-tools/flowchart.
- 2
BPMN.org. Business Process Model and Notation. www.bpmn.org/.
- 3
Louisiana Civil Service. Flowchart Symbols. www.civilservice.louisiana.gov/files/divisions/Training/Job%20Aid/Supervisor%20Toolbox/Flowchart%20Symbols.pdf.
- 4
APQC. How Do You Conduct a Process Map?. www.apqc.org/blog/how-do-you-conduct-process-map.