Glossary
Training Metrics
What are training metrics?
Training metrics are the measures a team uses to understand whether training is completed, understood, applied, and connected to better work. They can include activity data, assessment results, manager observations, quality scores, time to proficiency, error rates, and training ROI.1
The strongest training metrics show where learning turns into job performance and where it breaks down. Completion is only one signal.
Why training metrics matter
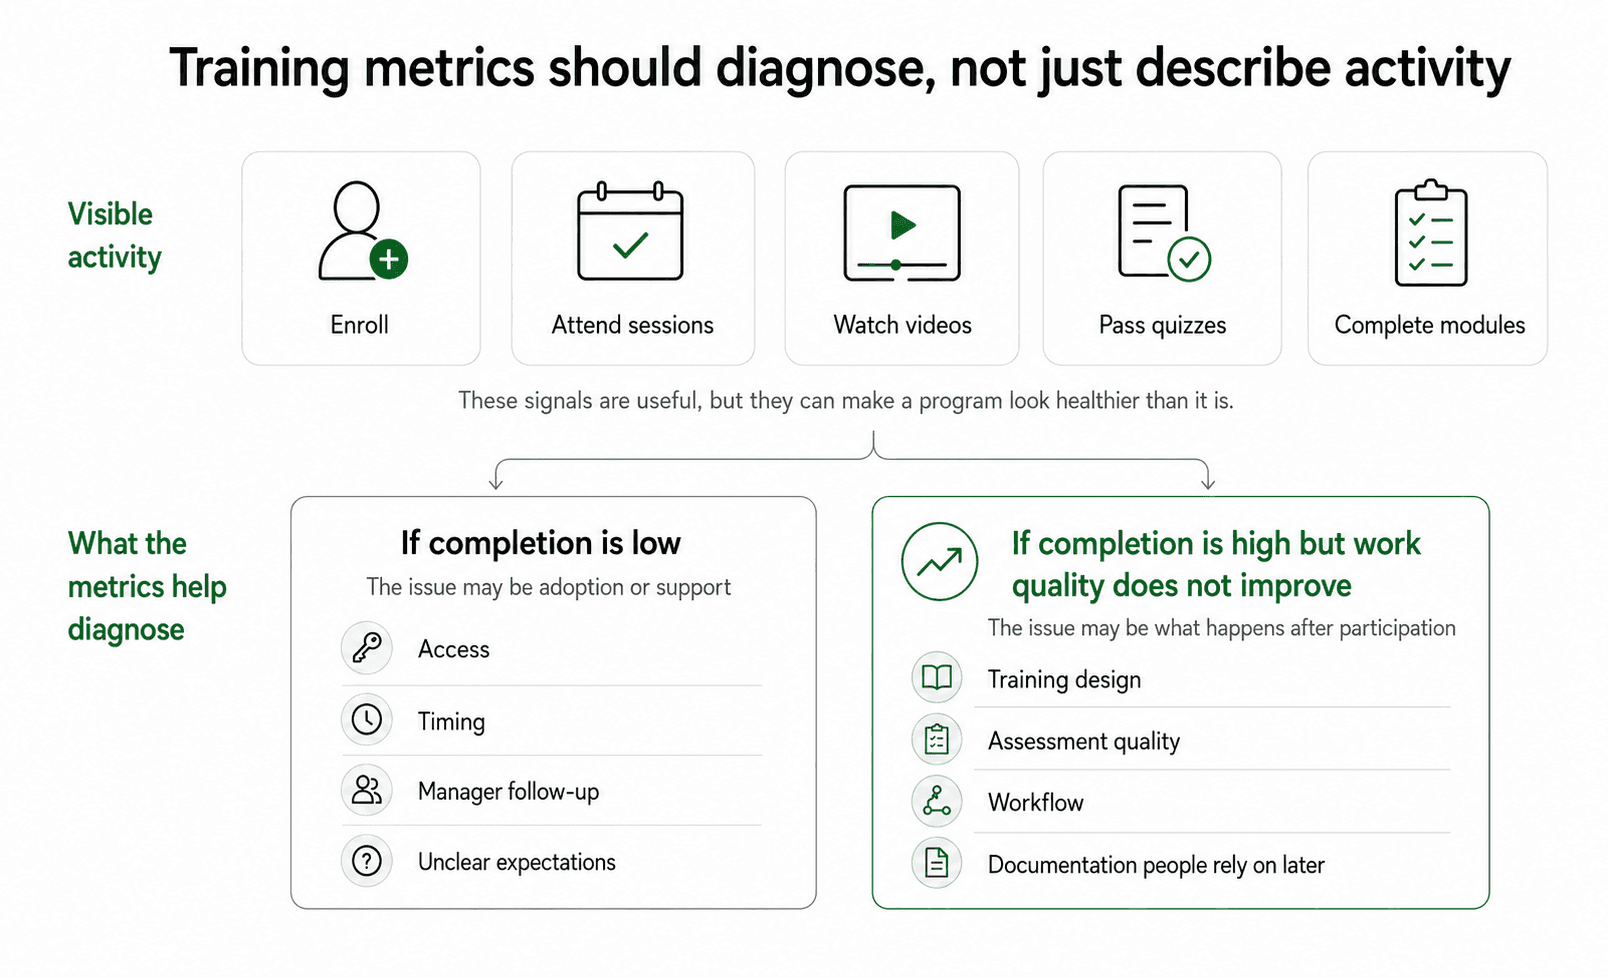
Training creates a lot of visible activity. People enroll, attend sessions, watch videos, pass quizzes, and complete required modules. Those signals are useful, but they can make a program look healthier than it is.
Training metrics matter because they separate participation from performance. If completion is low, the problem may be access, timing, manager follow-up, or unclear expectations. If completion is high but work quality does not improve, the problem may be training design, the assessment, the workflow, or the documentation people rely on later.
A good metric set behaves like a diagnostic. It should help the team decide what to fix next.
The five useful types of training metrics
Most teams need a mix of five metric types:
- Activity metrics show whether people engaged with training: enrollment, attendance, completion rate, and time spent.
- Learning metrics show whether people understood the material: scenario scores, quizzes, practice tasks, and teach-back quality.
- Behavior metrics show whether people apply the training on the job: manager observation, QA review, process adherence, and correct tool usage.
- Outcome metrics show whether the work improved: fewer errors, faster ramp time, reduced rework, improved response quality, or shorter cycle time.
- Maintenance metrics show whether the training system stays current: content age, review cadence, outdated guide count, and owner coverage.
Activity metrics are usually easiest to collect, so they often dominate dashboards. Behavior and outcome metrics take more effort, but they are closer to the real question: can people now do the work better?2
Examples of training metrics by use case
For employee onboarding, useful metrics might include time to first independent task, first-month manager readiness rating, repeated question volume, and quality of early work.
For customer support training, a team might track completion, scenario assessment score, QA score, escalation rate, first-contact resolution for trained issue types, and avoidable rework.
For operations or process training, metrics may include missed-step rate, cycle time, defect rate, handoff accuracy, and observed adherence to the documented workflow.
For software rollout training, completion tells only part of the story. Better metrics may include correct use of the trained workflow, avoidable support tickets, feature adoption for the specific task, and manager-confirmed readiness.
The pattern is simple: the metric should stay close to the behavior the training was meant to change.
How to choose training metrics
Start with this sentence:
## Training Metrics Planning Prompt

**Glossary term:** Training Metrics
**Source:** Trails Glossary — trails.so/glossary/training-metrics

---

### 01. Define the measurement path

"After this training, [audience] should be able to [do specific work] so that [business or operational result] improves.

Use that sentence to recommend:
1. What proves the training was completed.
2. What proves the learner understood the material.
3. What shows the behavior is happening in real work.
4. What operational outcome should improve.
5. Who owns each metric and how often it should be reviewed."
For example, "support agents should be able to apply the refund exception policy so that avoidable escalations decrease" points to several metrics: training completion, scenario assessment quality, QA review of refund cases, escalation rate, and manager coaching notes. Completion alone would be too shallow.3
Common mistakes
The first mistake is overvaluing completion. Completion means someone reached the end of the required material. It does not prove they understood the edge cases or can perform the work without help.
The second mistake is collecting too many numbers. A dashboard can look mature while burying the few signals that matter. Three well-chosen metrics tied to one behavior are usually more useful than twenty disconnected numbers.
The third mistake is blaming learners before inspecting the system. Weak metrics may point to outdated documentation, unclear ownership, bad timing, manager inconsistency, a broken workflow, or a mismatch between the assessment and the real job.
A practical training metrics checklist
Use these questions before building a training dashboard:
- What job behavior should change after the training?
- What proves the training was completed?
- What proves the learner understood the material?
- What shows the behavior is happening in real work?
- What operational outcome should improve if the behavior changes?
- Who owns each metric, and how often will it be reviewed?
- What decision will the team make if the metric moves in the wrong direction?
The last question is the filter. If no one will act on the metric, it is probably decorative.
Documentation takeaway
Training metrics are easier to interpret when the expected work is documented clearly. A step-by-step guide, job aid, checklist, or standard operating procedure gives managers a concrete standard to coach against and gives employees a reference after training ends.4
Documentation also makes metric problems easier to diagnose. If errors continue after training, the team can inspect the guide, the assessment, the workflow, and the support environment before assuming people simply failed to learn.
How Trails helps
Trails helps teams capture real workflows, turn them into polished step-by-step guides, and create AI-narrated video versions for training or sharing. That gives training metrics a stronger foundation: teams can measure against a clear workflow standard and update the guide when the process changes.
- Training ROI
- Training assessment
- Process metrics
- Training effectiveness
- Training platform
- Training documentation
- Training manager
Sources
- 1
Centers for Disease Control and Prevention. Measuring Training Effectiveness. CDC. www.cdc.gov/training-development/php/about/evaluate-training-measuring-effectiveness.html. Accessed June 30, 2026.
- 2
Kirkpatrick Partners. The Kirkpatrick Model. Kirkpatrick Partners. www.kirkpatrickpartners.com/the-kirkpatrick-model/. Accessed June 30, 2026.
- 3
Centers for Disease Control and Prevention. Building a Training Evaluation Plan. CDC. www.cdc.gov/training-development/php/about/evaluate-training-building-an-evaluation-plan.html. Accessed June 30, 2026.
- 4
Centers for Disease Control and Prevention. Quality Training Standards. CDC. www.cdc.gov/training-development/php/qts/index.html. Accessed June 30, 2026.