
Glossary
Process Efficiency
 ChatGPT
 Perplexity
 Gemini
 Claude
What is process efficiency?
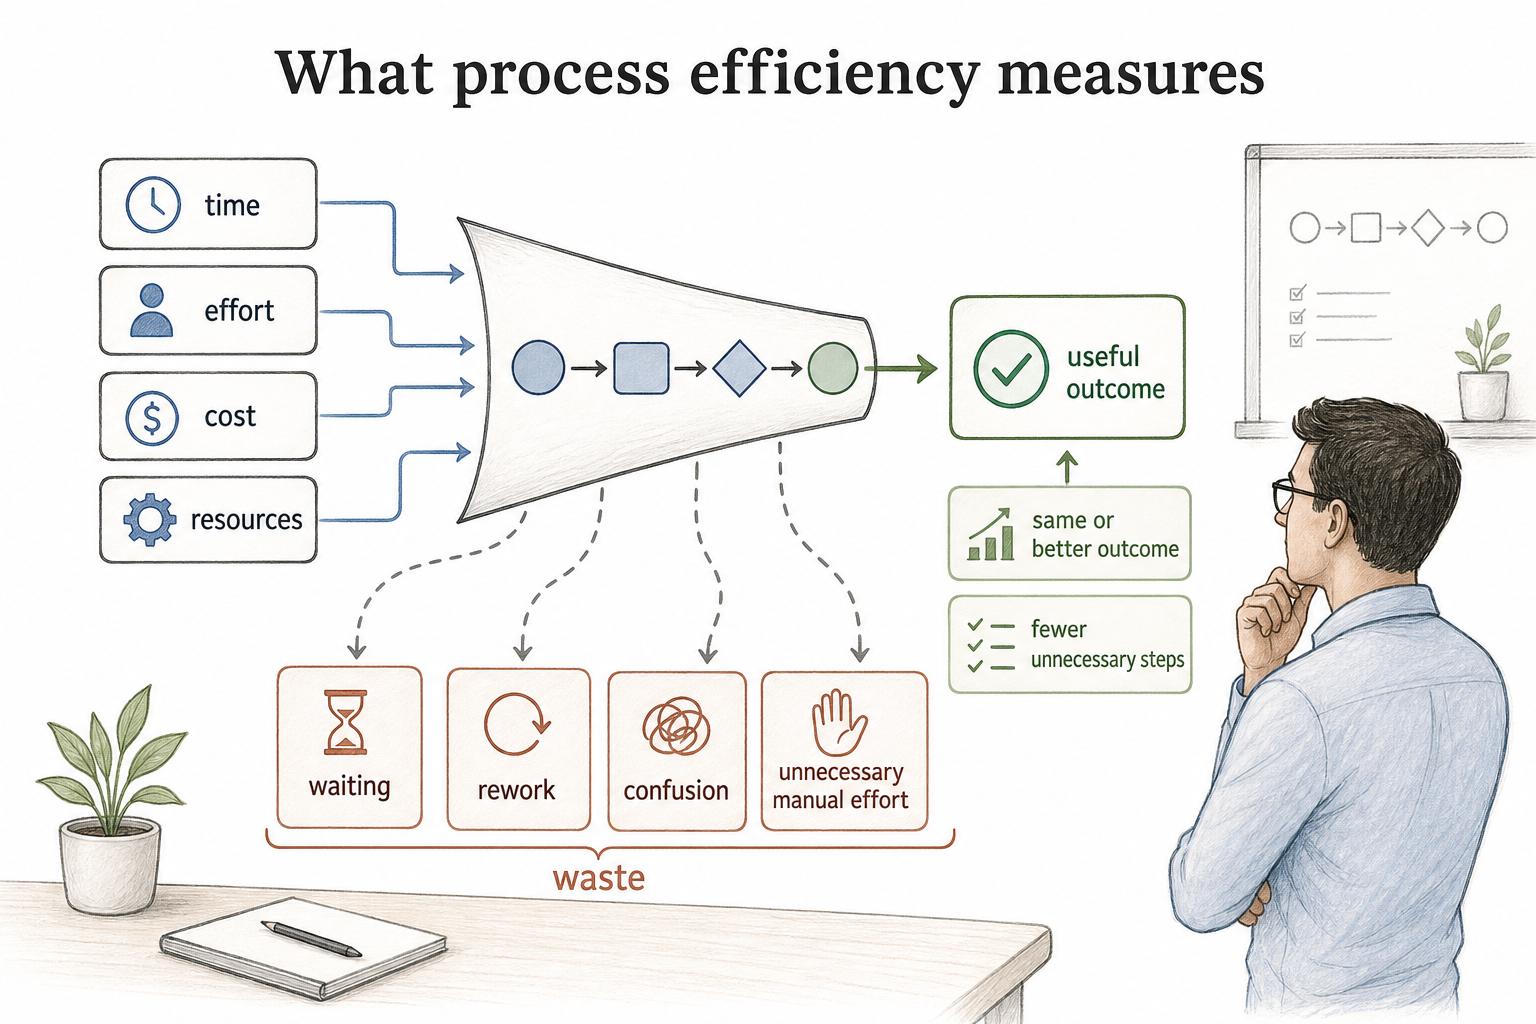
Process efficiency is how well a process turns time, effort, cost, and resources into a useful outcome. An efficient process reaches the intended result with less waste, waiting, rework, confusion, and unnecessary manual effort.1
Efficiency is not the same as rushing. A process that moves quickly while creating defects, compliance risk, customer frustration, or downstream cleanup is just moving the cost somewhere else.2
What process efficiency measures
Process efficiency compares what goes into a process with what comes out of it. Inputs can include employee time, approvals, tools, meetings, materials, handoffs, or management attention. Outputs can include resolved tickets, approved invoices, completed onboarding, shipped orders, trained employees, or any other finished result.
A process usually becomes more efficient when it produces the same or better outcome with fewer unnecessary steps, delays, corrections, duplicate data entries, or coordination work.
For example, a finance team might replace email-based invoice approvals with a structured intake form and a clear approval threshold. The win isn't only faster approvals. Fewer invoices arrive incomplete, fewer managers need follow-up, and finance has a cleaner record of what happened.
Process efficiency vs. process effectiveness
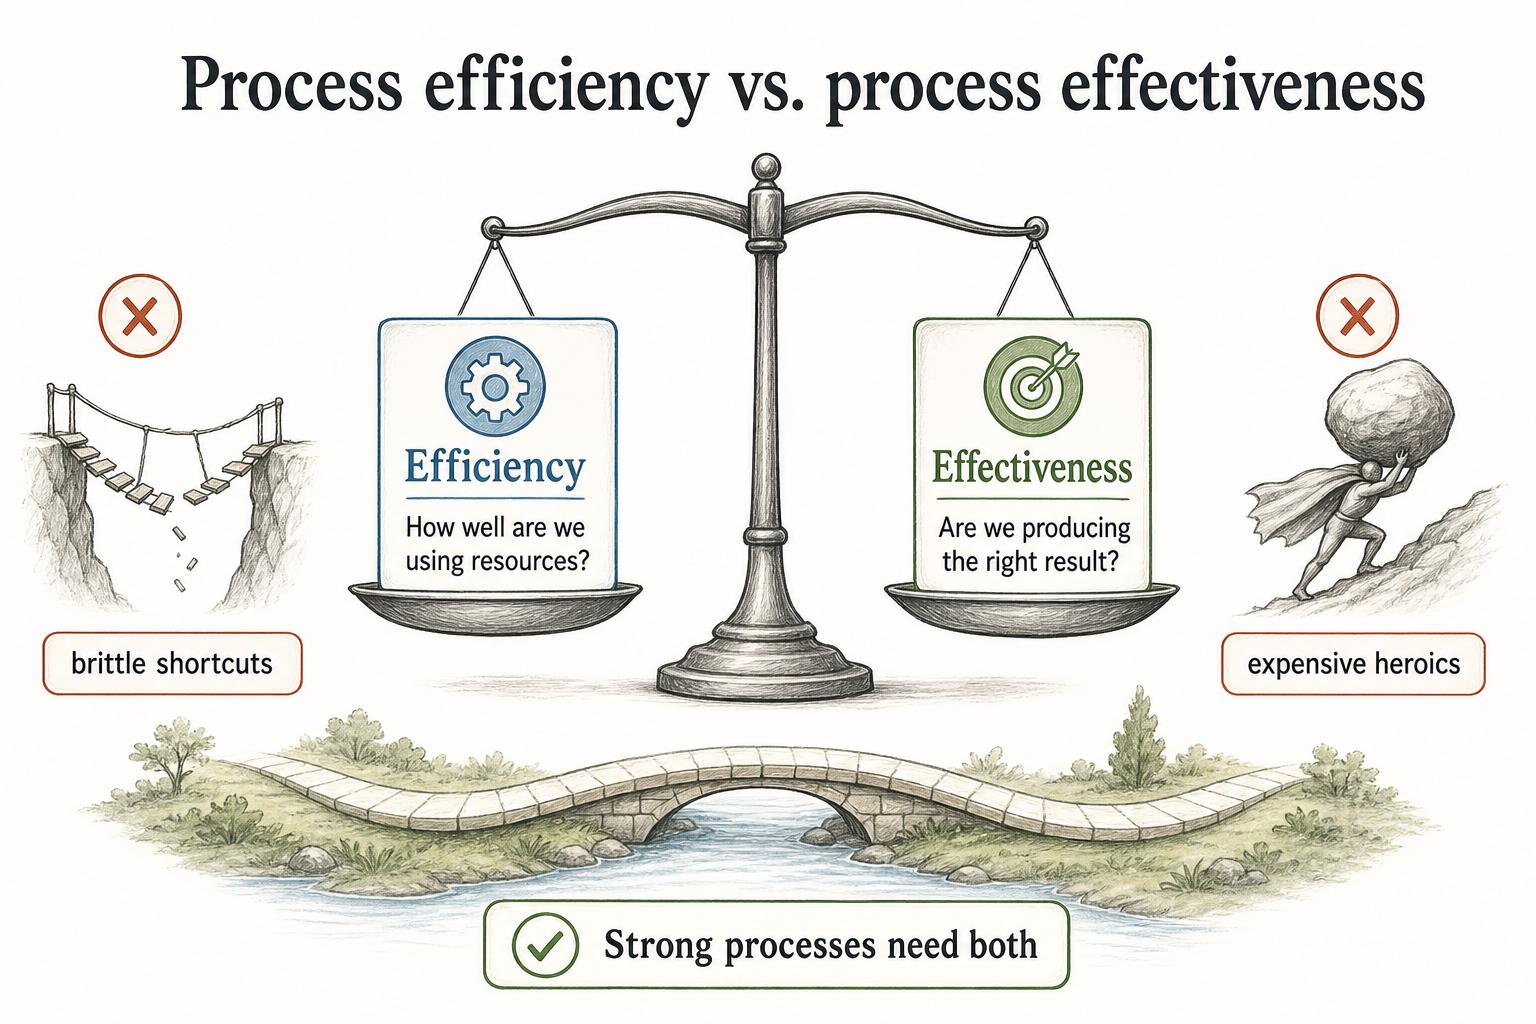
Efficiency asks, "How well are we using resources?" Effectiveness asks, "Are we producing the right result?"
A support team can close tickets quickly and still fail if customers reopen the same issue later. An onboarding team can launch customers successfully and still burn too much senior time if every launch depends on one person coordinating work manually.
Strong processes need both. Efficiency without effectiveness creates brittle shortcuts. Effectiveness without efficiency creates expensive heroics.
Common process efficiency metrics
No single metric proves that a process is efficient. The right set depends on the work, the risk, and the outcome the process is supposed to produce. Cycle time is one useful signal because it includes both active work time and waiting time.3
| Metric | What it helps reveal | Watch out for |
|---|---|---|
| Cycle time | How long work takes once it begins | Shorter cycle time can hide quality issues if measured alone |
| Waiting time | Where work sits idle between steps | Waiting often points to unclear ownership or capacity limits |
| Rework rate | How often work must be corrected or repeated | Rework is usually a symptom of weak inputs or unclear standards |
| Handoff count | How many times work changes owner | More handoffs can mean more lost context |
| Error rate | How often the process produces mistakes | A lower error rate may matter more than raw speed |
| Cost per output | Resources required for each completed result | Cost cutting can backfire if it creates downstream cleanup |
Use metrics to locate waste, not to punish the people inside the process. Many efficiency problems are design problems: the process asks people to compensate for missing information, awkward tools, or unclear decisions.
How to improve process efficiency
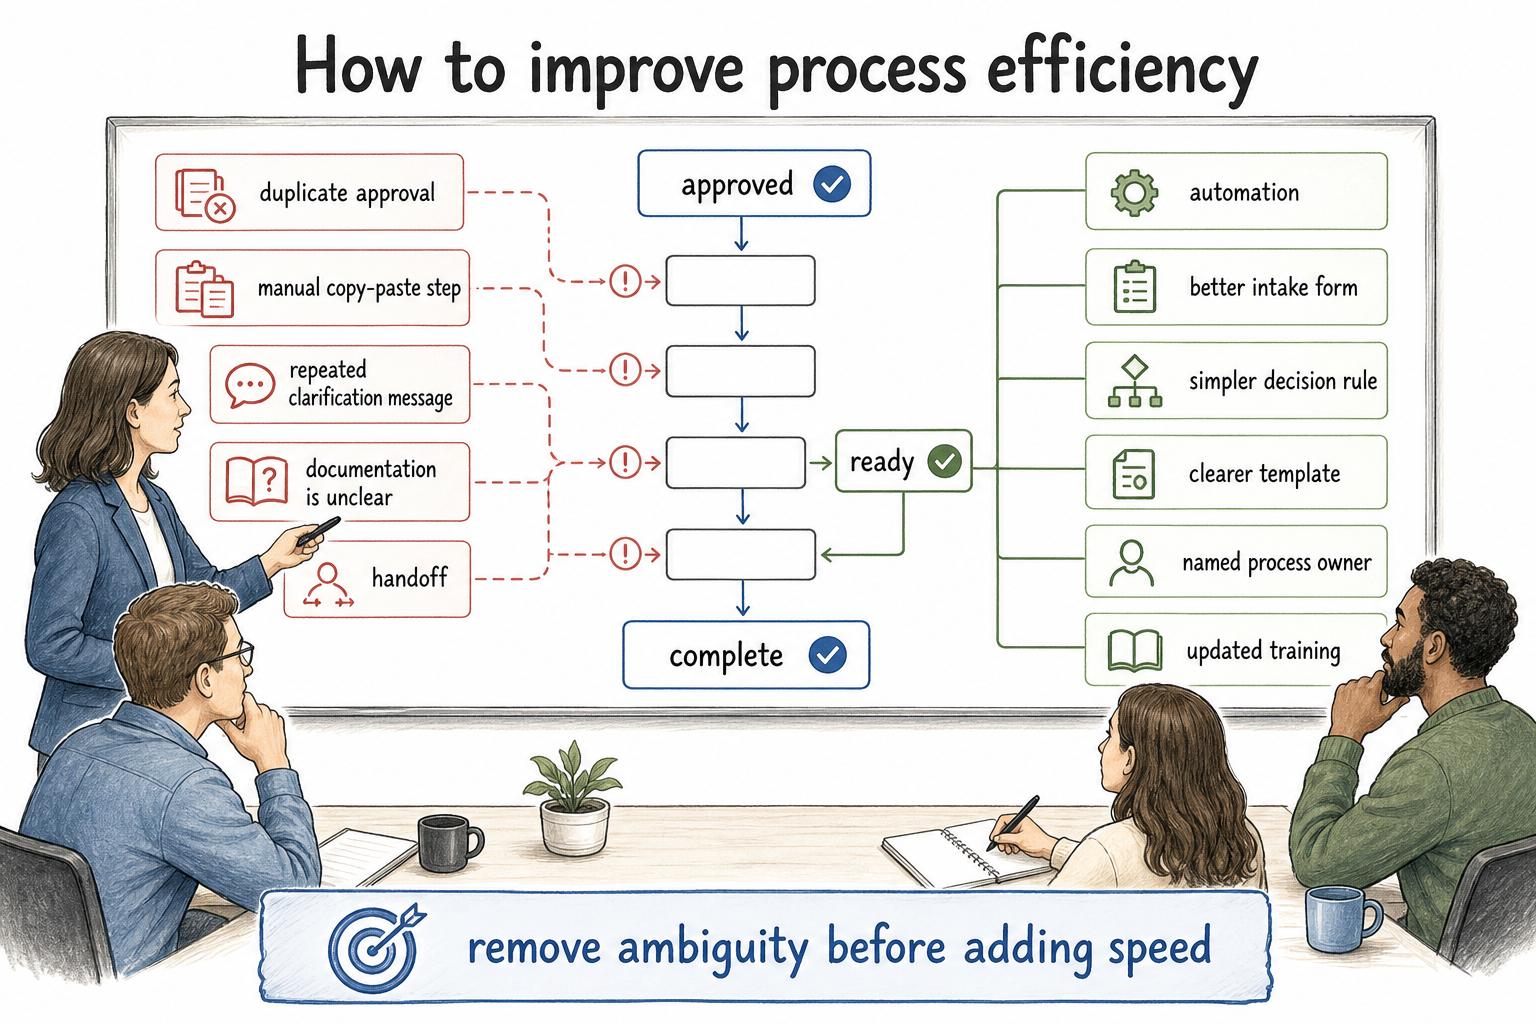
Start by finding where the process consumes effort without adding value. That might be a duplicate approval, a manual copy-paste step, a repeated clarification message, a meeting that only exists because the documentation is unclear, or a handoff that regularly comes back incomplete.4
Then choose the fix that matches the problem. Some efficiency problems need automation. Others need a better intake form, a simpler decision rule, a clearer template, a named process owner, or updated training. Automation helps when the process is already understood. It gets risky when it freezes a broken workflow into software.
A practical rule: remove ambiguity before adding speed. If people disagree about what "approved," "ready," or "complete" means, faster movement will only push confusion to the next step sooner.
Example of process efficiency
Imagine a customer success team that spends too much time preparing quarterly business reviews. Each CSM pulls product usage, ticket history, account notes, and renewal risk from different systems. The final presentation is useful, but preparation takes too long and varies by person.
A process efficiency improvement might standardize the data pull, create a reusable review template, define when each section is required, and document the preparation workflow. The team keeps the quality of the review while reducing the manual assembly work.
The improvement is measurable and operationally healthier. New CSMs learn the process faster, managers can coach from a shared standard, and customers get a more consistent review.
Common mistakes
One mistake is optimizing a local step while damaging the full process. A team may make its own queue faster by sending less context downstream, forcing the next team to do more cleanup.
Another mistake is confusing fewer steps with better flow. Some steps are controls, quality checks, or useful decision points. Removing them may make the process look leaner while increasing risk.
A third mistake is failing to document the improved version. Efficiency gains disappear when the new process lives only in a project recap or in the head of the person who redesigned it.
Documentation takeaway
Process efficiency improves when people can see the workflow, understand the standard, and repeat the improved version without relying on memory. Documentation makes the new process visible and trainable.
Use process maps to find waste. Use SOPs, checklists, templates, and step-by-step guides to make the better flow repeatable.
How Trails helps
Trails helps teams capture a workflow as someone performs it and turn that workflow into a polished guide. When a team improves a process, Trails can document the updated steps and create an AI-narrated video version for training or rollout.
That helps efficiency work move beyond analysis. The improved process becomes something people can actually follow.
Sources
- 1
APQC. APQC process-efficiency measure. www.apqc.org/what-we-do/benchmarking/open-standards-benchmarking/measures/percentage-change-cycle-time-reduction.
- 2
ISO. ISO 9001 process approach. www.iso.org/obp/ui/.
- 3
APQC. APQC cycle-time measure. www.apqc.org/resources/benchmarking/open-standards-benchmarking/measures/primary-product-manufacturing-cycle.
- 4
Lean Enterprise Institute. Seven Wastes. www.lean.org/lexicon-terms/seven-wastes/.