
Glossary
Process Metrics
 ChatGPT
 Perplexity
 Gemini
 Claude
What are process metrics?
Process metrics are measurements that show how a workflow or business process is performing. They help teams see whether work is moving fast enough, staying accurate, meeting requirements, and producing the outcome the process exists to deliver.1
A useful process metric gives someone a next move. It should help a process owner decide where to investigate, what to improve, whether a change worked, or when the process is drifting out of control.
What process metrics measure
Process metrics should start with the reason the process exists. A support process might track response time, resolution quality, reopen rate, and escalation volume. An onboarding process might track time to first value, missed setup steps, customer handoffs, and completion rate. A finance process might track approval cycle time, exception rate, payment accuracy, and policy compliance.
Most process metrics fall into a few categories:
- Speed: how long the process or a step takes.
- Quality: how often the work meets requirements without correction.
- Volume: how much work moves through the process.
- Reliability: how consistently the process meets expected timing or quality.
- Cost or effort: how much labor, money, or system capacity the process consumes.
- Compliance: whether required controls, approvals, or records are followed.
- Experience: whether the process creates a better or worse experience for the people it serves.
The trap is measuring whatever is easiest to count. A team can track tasks completed, meetings held, or documents created without learning whether the process is healthier.2
Common examples of process metrics
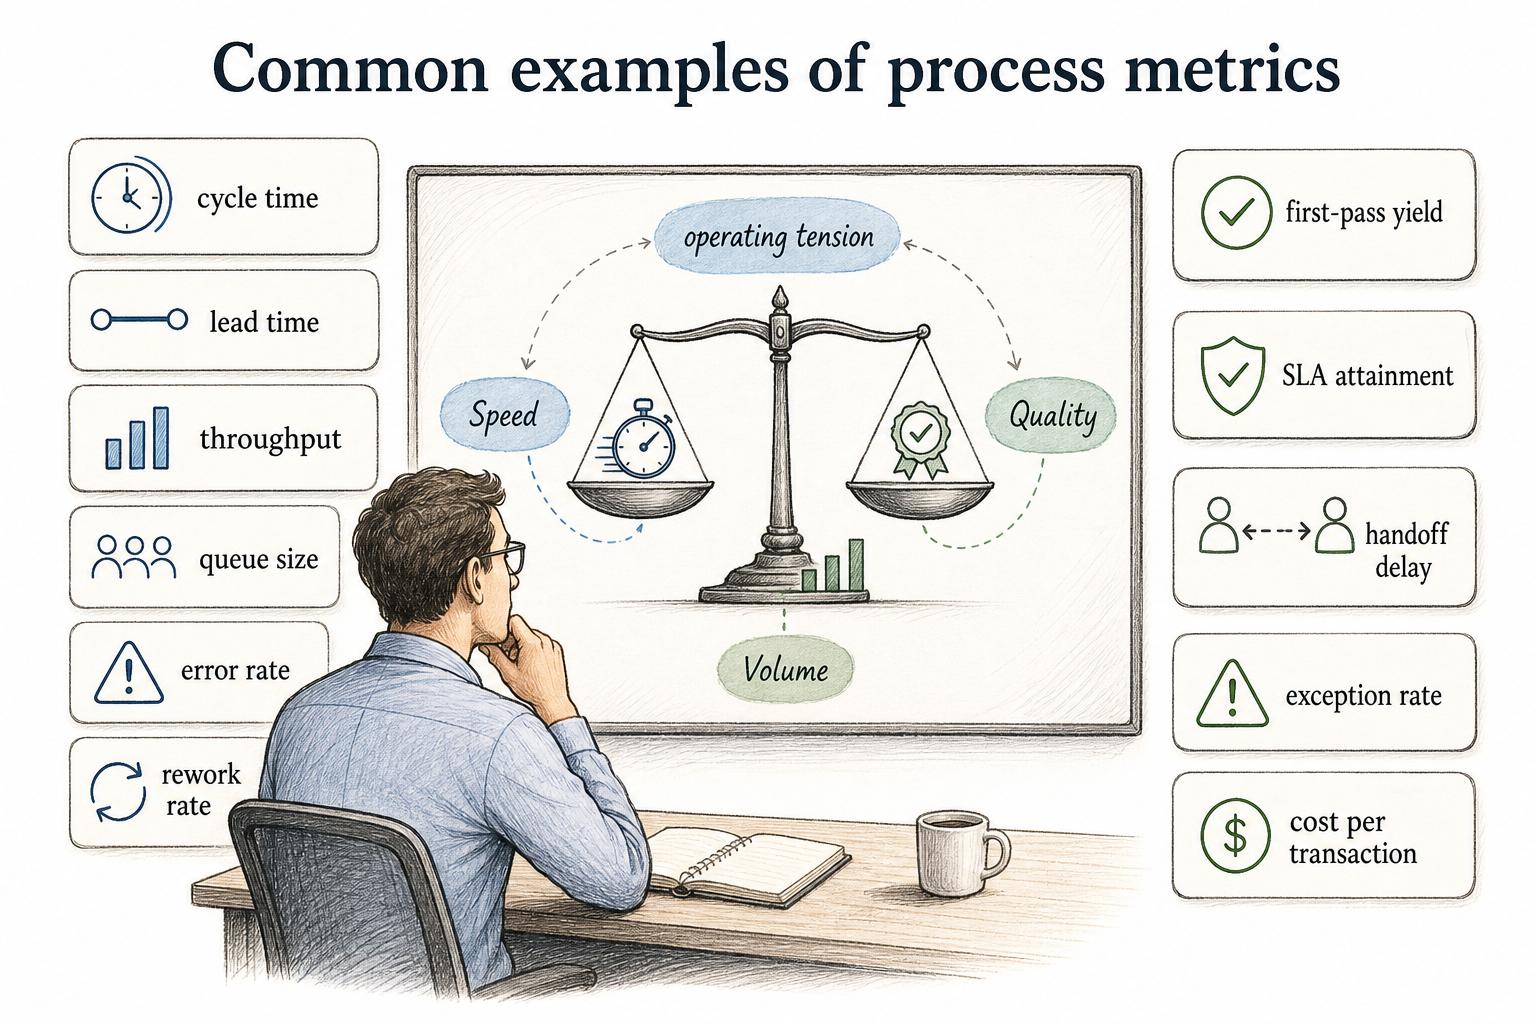
Common process metrics include cycle time, lead time, throughput, queue size, error rate, rework rate, first-pass yield, SLA attainment, handoff delay, exception rate, and cost per transaction.
The right metric depends on the job of the process. A customer support team may care about first response time, time to resolution, reopen rate, escalation rate, and customer satisfaction after resolution. A procurement team may care about requisition-to-approval time, supplier onboarding completion, contract exception rate, and percentage of purchases outside policy.
Pair metrics that reveal tradeoffs. Speed alone can reward rushed work. Quality alone can hide unacceptable delay. Volume alone can normalize overload. A useful metric set shows the operating tension, not just the number leadership wants to move.
Process metrics vs. KPIs
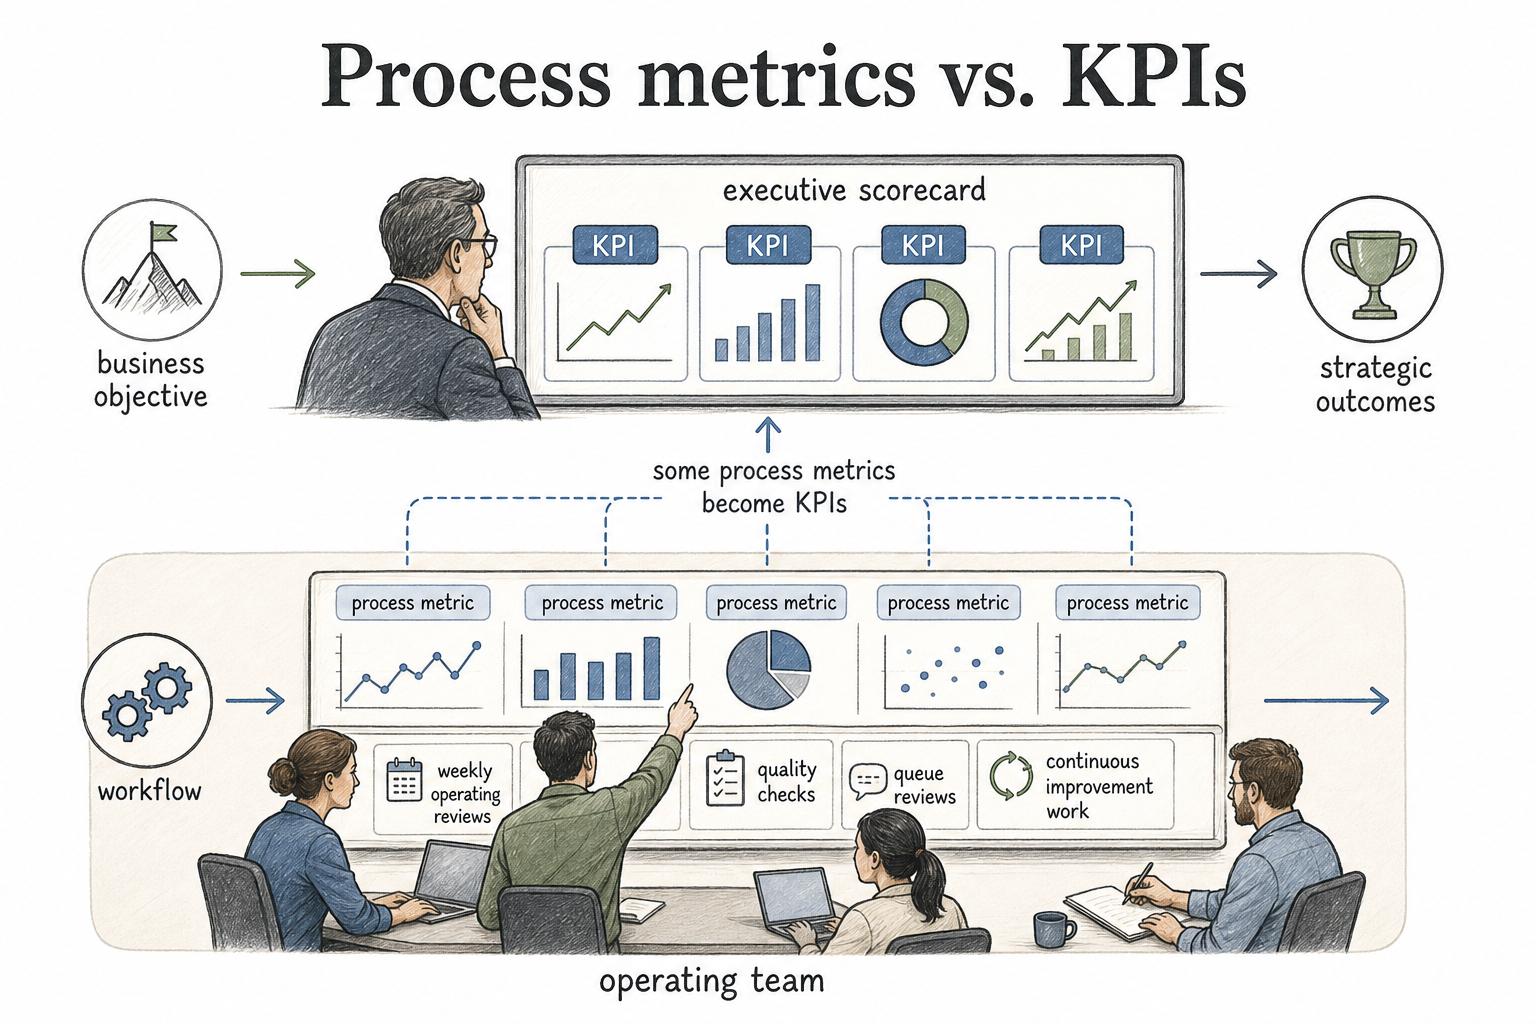
A process metric measures part of a workflow. A KPI measures progress against an important business objective. Some process metrics become KPIs, but many should stay closer to the operating team.
Average invoice approval time, for example, may be a finance operations metric. If invoice speed affects cash management, vendor trust, or a company-wide finance goal, it might become a KPI.
This distinction keeps teams from turning every useful signal into an executive scorecard. KPIs should be few, visible, and tied to strategic outcomes. Process metrics can be more detailed because they are often used in weekly operating reviews, quality checks, queue reviews, and continuous improvement work.
How to choose process metrics
Start with the decision the metric will support. A metric with no owner and no decision attached usually becomes reporting theater.
Use this decision rule:
- Keep the metric when it would change what someone does next week. It can guide staffing, training, documentation, automation, escalation, quality review, or process redesign.
- Challenge activity counts. They are useful when they explain capacity, demand, or progress toward an outcome. They are weak when they only prove that work happened.
- Measure the counterweight. If improving one metric can damage another, pair them. Faster approvals should be read alongside error rate, exception rate, or control failures.
A practical set often includes one outcome metric, one speed metric, one quality metric, and one leading indicator. For onboarding, that might be completion rate, onboarding lead time, missed handoffs, and setup checklist completion.
What to document for each process metric
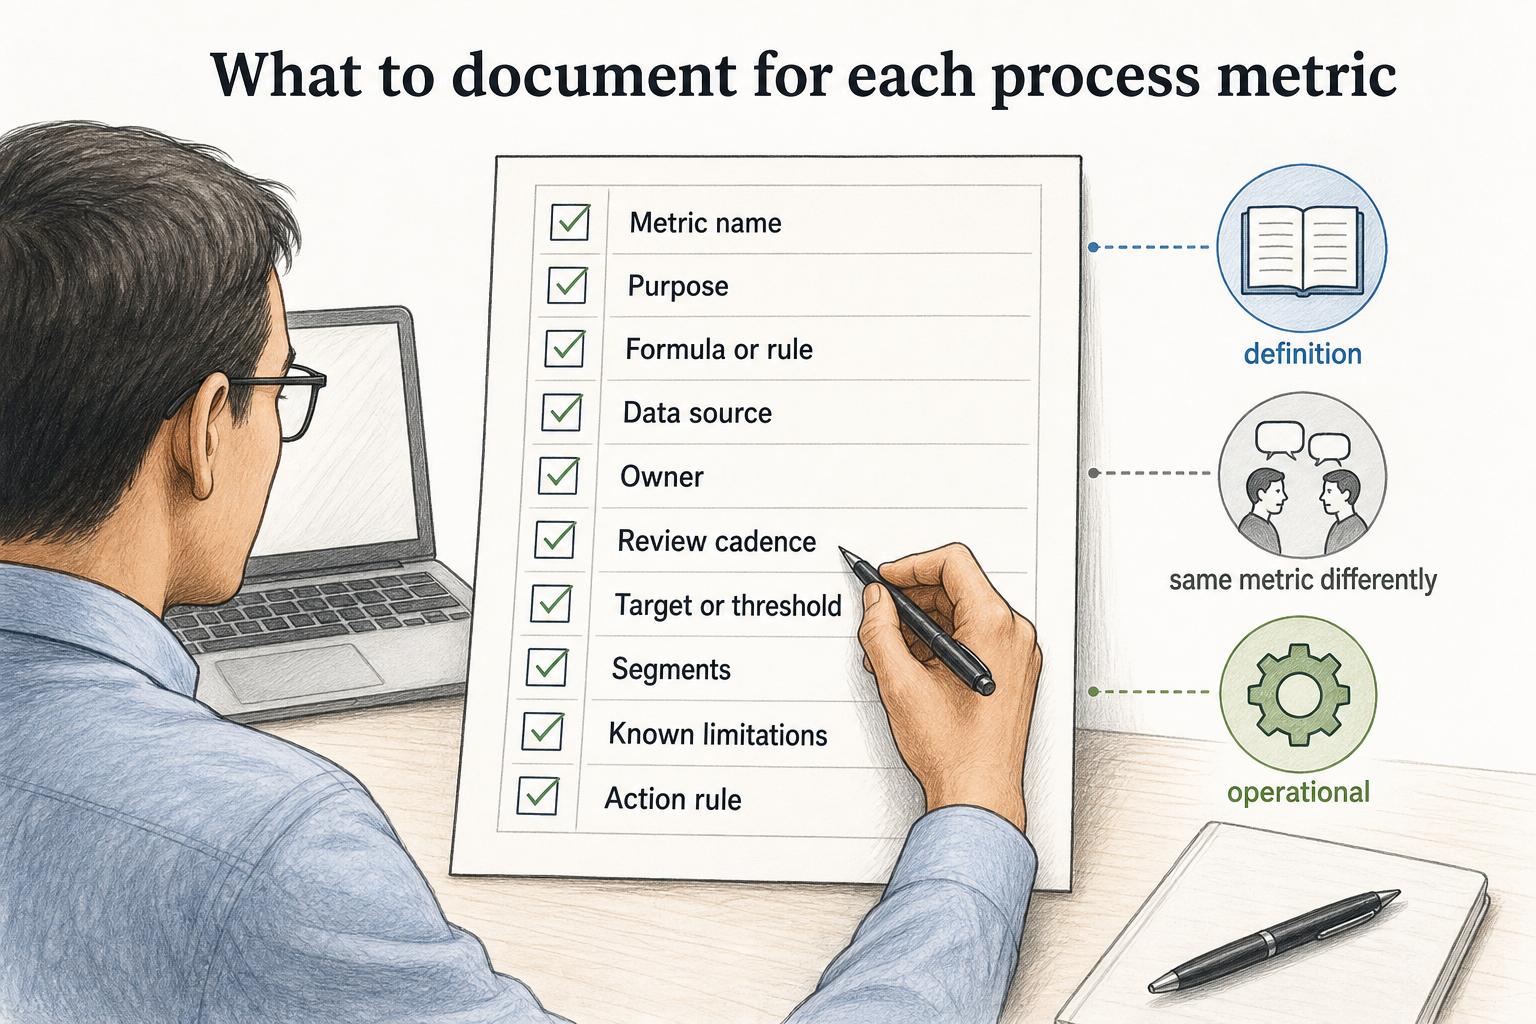
Every important process metric needs a definition. Without one, teams calculate the same metric differently and argue about the number instead of improving the process.3
A compact metric definition should include:
- Metric name: the plain-language name everyone will use.
- Purpose: the decision the metric supports.
- Formula or rule: exactly how it is calculated.
- Data source: where the data comes from.
- Owner: who reviews and acts on it.
- Review cadence: when the metric is checked.
- Target or threshold: what range is acceptable.
- Segments: whether the metric should be broken down by team, region, customer type, priority, product, or process variant.
- Known limitations: what the metric does not show.
- Action rule: what happens when the metric moves outside range.
The action rule is where the metric becomes operational. Without it, a metric can sit on a dashboard for months without changing the process.
Common mistakes
The first mistake is choosing too many metrics. A dashboard with thirty numbers can make the process feel measured while leaving the team unsure what to fix. Fewer metrics with clear ownership usually create more movement.
The second mistake is measuring the average and missing the pain. Average cycle time might look fine while a small group of cases waits for weeks. Use segmentation when the process differs by request type, customer tier, region, risk level, or exception path.
The third mistake is using metrics to pressure the people closest to a broken system. If the process design creates delay, individual performance pressure won't fix the handoff, policy, tooling, or documentation gap underneath it.
Documentation takeaway
Process metrics are easier to trust when the underlying workflow is clearly documented. The team needs to know what counts as the start, what counts as done, which exceptions are legitimate, who owns each handoff, and where the metric data comes from.
When a metric exposes recurring delays or rework, update the process guide alongside the dashboard. Otherwise the number may improve briefly and then drift back because the operating behavior never changed.
How Trails helps
Trails helps teams document the work behind process metrics. When a metric shows inconsistent handoffs, repeated errors, or unclear ownership, teams can use Trails to capture the workflow as someone performs it, turn it into a polished step-by-step guide, and create an AI-narrated video version for training or sharing.
That keeps measurement connected to how the work is actually done.
Sources
- 1
NIST. Baldrige Criteria Commentary. National Institute of Standards and Technology. www.nist.gov/baldrige/baldrige-criteria-commentary.
- 2
ISO. The Process Approach in ISO 9001:2015. International Organization for Standardization. www.iso.org/iso/iso9001_2015_process_approach.pdf.
- 3
APQC. Business Process Owners. APQC. www.apqc.org/resources/blog/business-process-owners.